See also the layperson's introduction: Jumping frogs, squeaking bats and tapping woodpeckers and Watching ripples on crystals.
Now we have applied our surface wave imaging technique to periodic structures. This should prove useful for developing new phononic devices such as filters for cell phones.
The image on the right shows an approximately 150 μm×150 μm region of a microscopic array of copper and silica bars on a silicon substrate. The bars are each only 2 μm in width. The image on the left shows ripples generated by an ultrashort laser pulse striking the centre of the structure.
Sloshing Bloch waves. Right: one-dimensional phononic crystal structure (optical microscope image). Left: ripples visualized. To animate click the image (980 kb movie).
Sound in such regular structures, or phononic crystals, is forced into vibrational patterns known as Bloch waves. You can see the Bloch waves "sloshing" backwards and forwards (click the image).
Another way to see the Bloch waves is to plot the data in the form of an angle-radius plot, as below. Somewhat mesmerizing?
Ripples shown on an angle-radius plot. To animate, click the image (407 kb movie). Angle (of wave motion) versus distance (from point source). The axes correspond to 0-360 degrees versus 10-65 μm. Zero degrees corresponds to the horizontal direction.
The waves travel faster along the bars—a symptom of the structure's anisotropy—producing the bunching seen 1/4 and 3/4 of the way up the image.
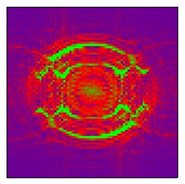
Interestingly, such waves lie in frequency ranges called bands, there being gaps where no waves can pass. We have derived from our data the character of these bands and gaps. Our method reveals a complex web of bands of different sound polarizations, analogous to that which exists for electrons in semiconductors, and photons in photonic crystals. See the image below for an example.
The evil eye is watching you. Eye-shaped band structure at a frequency of 534 MHz (in two-dimensional k-space obtained by Fourier transforming the data). More details about this image.
The horizontal gap through the central portion of the image means that there is a band gap for horizontally directed waves.
More band structure. To animate, click the image (230 kb movie). (Shown in two-dimensional k-space over the range −3.2 to +3.2/μm.)
The faint ghost-like rings, seen either side of the central features in these images, are called Bloch harmonics. They arise because the phononic crystal scatters the surface acoustic waves and changes their spatial distribution.
This direct visualization of the two-dimensional band structure is a bonus for designing surface phononic crystals. You get the whole band structure in one fell swoop. We now have similar results on phononic crystals consisting of square arrays of holes. See 'Watching ripples on square phononic crystal lattices,'
(For more details, see 'Imaging ripples on phononic crystals reveals acoustic band structure and Bloch harmonics,' D. M. Profunser, O. B. Wright and O. Matsuda, Phys. Rev. Lett. 97 055502, 2006.)
Feel the phononic tonic!