Picosecond acoustic pulses are tiny in extent, typically less than 0.1 μm long. We previously presented a tomographic method for visualizing picosecond strain pulses in transparent solids 'Tomographic reconstruction of picosecond acoustic strain propagation,' M. Tomoda, O. Matsuda, O. B. Wright and R. Li Voti, Appl. Phys. Lett. 90, 041114 (2007). Here we present an extension of this work to higher spatial resolution using automatic scanning.
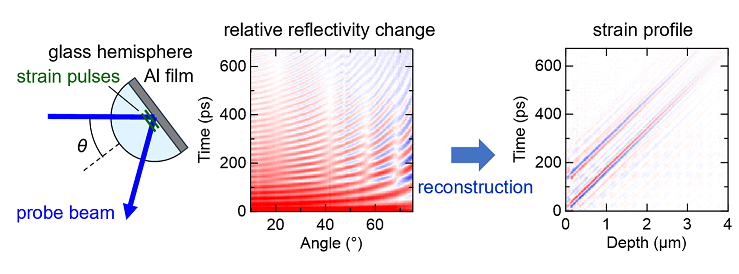
We use a sample in the form of a 10 mm diameter glass hemisphere, with the flat surface coated with aluminum. Picosecond acoustic pulses generated by infrared laser pulses in the aluminum travel into the glass, where we detect them with blue laser pulses. See the figure.
Schematics of picosecond acoustic tomography, angular dependence of the optical reflectance change, and reconstructed acoustic pulses.
By rotating the hemisphere and making measurements at different angles we build up a databank of results that can be analysed by a computer algorithm. We thereby extract the shape of the acoustic pulse as it moves through the glass. See the animation below.
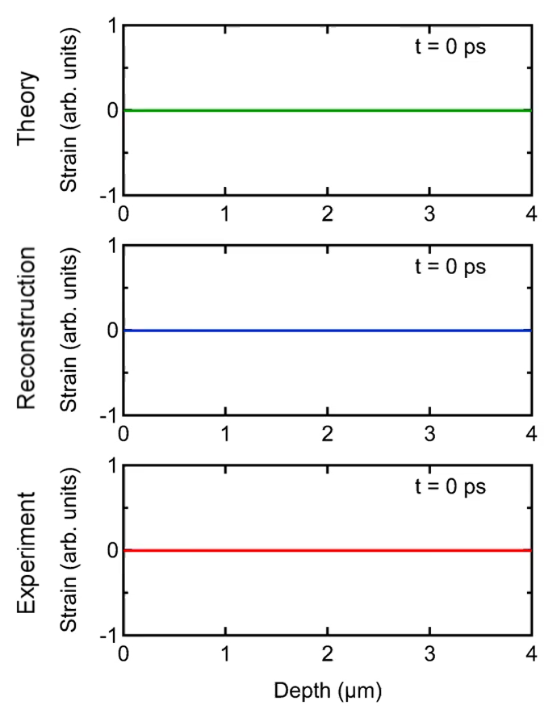
Click the image to see a 254 kB animation of the picosecond acoustic pulse in the glass.
Three animations are shown. The one labeled "Theory" is a simulation of the ultrasonic pulse waveform at each time. The one labeled "Reconstruct" is a reconstruction of the acoustic pulse shape. The one labeled "Experiment" is the experimentally derived acoustic pulse shape.
The frequency of this acoustic pulse is about 20 GHz. You can also make out a second, smaller acoustic pulse later in the animation. This is an acoustic echo generated at the interface between the glass and the aluminum film, traveling once throught the aluminum film and then propagating back to the glass hemisphere.
This method should prove useful for understanding the shape of picosecond acoustic pulses and how they change when travelling. For more details see 'Tomographic reconstruction of picosecond acoustic strain pulses using automated angle-scan probing with visible light,' M. Tomoda, H. Matsuo, O. Matsuda, R. Li Voti and O. B. Wright, Photoacoustics. 34, 100567 (2023).