See also the layperson's introduction: Jumping frogs, squeaking bats and tapping woodpeckers and Watching ripples on crystals.
The way sound moves in patterned structures is extremely complicated, and is best understood by considering each acoustic wavelength (the length of a sound wave), one at a time.
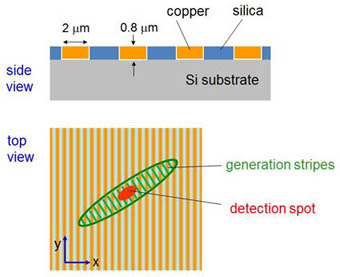
We have used this approach to investigate a phononic crystal in the form of an array of copper and silica bars on a silicon substrate. We use a pulsed laser beam focused to a striped pattern (shown in green) to generate surface acoustic waves.
Here is the sample and configuration of laser beams.
Another laser beam detects the sample motion. The orientation of the laser pattern and the laser stripe separation is changed, and the experiment is repeated. We build up a picture in this way of how sound waves of different wavelength travel in different directions.
The results can be shown as so-called "dispersion surfaces", essentially graphs of the sound frequency (that is, the pitch) against the reciprocal of the wavelength (or wave number k). These surfaces are very rarely completely measured in experiment.
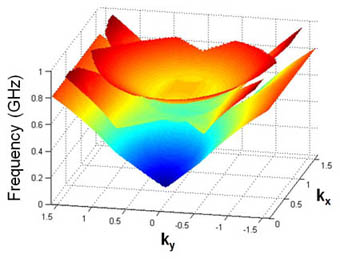
These are the measured dispersion surfaces.
The topology of the dispersion surfaces arises from the interaction of two kinds of surface wave with each other and with the structure.
We hope that our work will stimulate more measurements on the dispersion surfaces of phononic and photonic crystals. Two- and three-dimensional lattices will undoubtedly yield interesting dispersion surfaces too.
For more details, see 'Mapping the band structure of a surface phononic crystal,' A. A. Maznev, O. B. Wright, and O. Matsuda, N. J. Phys. 13, 013037, 2011.