See also the layperson's introduction: Jumping frogs, squeaking bats and tapping woodpeckers and Picosecond ultrasonics with ultrashort light pulses.
Ice is ubiquitous in the universe, forming on comets, moons and asteroids for example. It is more familiar on Planet Earth as the translucent lump in your fizzy drink, or those white crystals on the ski slopes. Less usefully, ice can also freeze up the windows of your house, or cling to aeroplane wings. It can also be a nuisance if it forms on the inside of a scientist's low temperature apparatus.
Our original grand idea had nothing to do with ice, but was in fact to generate sound pulses with very short laser pulses in a film of the superconductor YBCO (standing for yttrium, barium, copper and oxygen) using picosecond ultrasonics.
But instead of the clear acoustic echo signals expected, we saw rapid wiggles that slowly changed in form over several hours. Watch the animation and see how the signal changed.
Click the image to see a 200 kB animation of the reflectivity change of the sample, shown over an 18 hour period. The laser is switched off between 10 and 15 hours of observation.
Could this be the beginning of the discovery of a totally new and as-yet undiscovered property of superconductors? Could a Nobel prize be just around the corner?
After scratching our heads for a very long time, we (well, Osamu) realised that in fact a miniscule layer of ice was slowly building up on the sample, up to a maximum thickness of one micron (10-6 m).
Hooray, let's study ice then. So much for the Nobel prize, but what an appropriate topic for a group at North-leaning Hokkaido University.
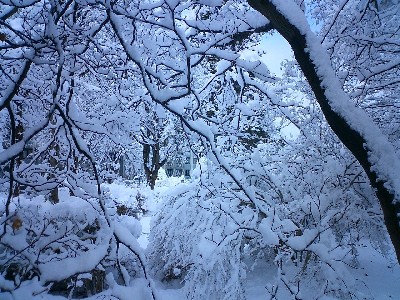
The ice thickness in our campus is somewhat thicker than in our experiment.
By analysing the wiggles in the signal, we found we could monitor the ice thickness as it was growing, and derive a fair number of physical properties of ice for the first time at our very high ultrasonic frequencies around 10 GHz.
Here we show how the experiment (top graph) and theory (bottom graph) nicely matched.
Graph of the optical reflectivity during the ice film growth as a short acoustic pulse travels through it. Blue means an increase in reflectivity and red means a decrease. Click the figure to see a 280 kB animation of these results.
Watching ice films grow for 20 hours or more is enough to make any researcher weary.

No escape while the experiment is running.
For more information see 'In-situ monitoring of the growth of ice films by laser picosecond acoustics,' S. Kashiwada, O. Matsuda, J. J. Baumberg, R. Li Voti, and O. B. Wright, J. Appl. Phys. 100, 073506 (2006).