See also the layperson's introduction: Jumping frogs, squeaking bats and tapping woodpeckers...
Golden ripples. See below for 6 more animations.
Using ultrashort laser pulses we have generated and dynamically imaged tiny ripples of sound on surfaces, so-called surface acoustic waves. A point source of sound on a crystal surface can produce beautiful ripple patterns because the speed of sound depends on direction, highly concentrating the acoustic energy in certain directions. This is known as phonon focusing.
Animations of the surface phonons - the atomic vibrations that make up sound - can be viewed in real time with micron lateral resolution (1 micron=10-6 m). Here is the apparatus we use. (See below for the animations.)
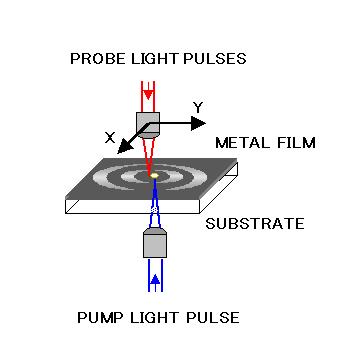
We generate and detect the surface waves in metal films on transparent substrates using ultrashort light pulses of duration about 1 picosecond (10-12 s). A blue light pulse excites the sound waves through thermal expansion by illumination through the transparent substrate. Surface sound waves are launched laterally, as opposed to directly into the solid for longitudinal sound waves (see Picosecond sound pulse generation and detection with ultrashort light pulses).
The wavelength of the surface waves is determined by the optical spot size on the surface, a few microns, corresponding to ultrasonic frequencies in the 100 megahertz to 1 gigahertz range (108 to 109 cycles/second).
The heart of the detection scheme is an optical interferometer. By bouncing ultrashort infrared probe light pulses from the sample we measure the motion of the surface (its out-of-plane velocity in fact). The laser beam is scanned across the surface of the sample to build up an image. Repeating the process at different times allows us to produce animations of the ripples. These ripples are really tiny, moving the surface by only about 10 picometres (10-11 m). This is more than a million times smaller than the width of a human hair, even smaller than the diameter of an atom.

To animate, click the left image. (163 kb movie, same as above)
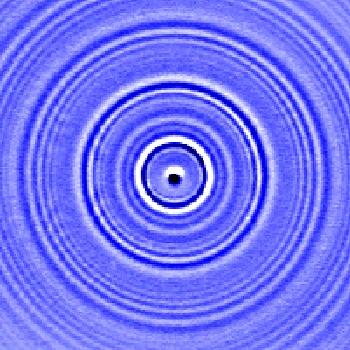
The animation on the left shows a 90 micron × 90 micron region of an isotropic crown glass substrate of thickness 1 mm coated with a 70 nanometre (1 nanometre=10-9 m) gold film. The picture on the right shows a 200 micron × 200 micron region. The circular ripples are reminiscent of those of water. Because of the effect of the gold film, the smaller (wavelength) ripples go slower than the larger ripples, leading to a broadening of the ripples as they propagate. This is known as dispersion.
In water the smaller ripples go faster, so you can tell in this case that these ripples could not be on water. Can you?
By analysing the ripple pattern we can determine the film thickness and investigate the elastic properties of the sample.
A blue light pulse arrives every 12.5 nanoseconds on the centre of the pattern. The actual sound velocity of the surface waves is about 3000 ms-1. Solids are stiff so this is much faster than in air (330 ms-1). The acoustic strain penetrates the solid to a depth of the order of the acoustic wavelength, about 10 microns. Surface waves make the atoms of the solid move in elliptical trajectories.
To animate, click the image. (173 kb movie)
The animation shows a 200 micron × 200 micron region of a lithium fluoride (LiF) crystal of thickness 1 mm coated with a 50 nanometre gold film. LiF crystal shows cubic symmetry. So the ripples are beautiful rounded squares for this (100) crystal cut. The ripples are not circular because the sample is anisotropic.
What are these atomic creatures? Click the image.
This arises because crystal lattices are made up of individual atoms linked by chemical bonds that can oscillate like springs. These allow the vibrational waves, the phonons, to pass through the structure. The strength of the springs and the atomic separation is different for different directions, and so the stiffness of the solid and the inertia of the lattice is different for phonons travelling in different directions. This leads to the dependence of the sound velocity on direction (that is, to the anisotropy in the sound velocity).
To animate, click the images. (286 kb and 165 kb movies)
The blue animation on the left shows a 150 micron × 150 micron region of a tellurium oxide (TeO2) crystal of thickness 1 mm coated with a 40 nanometre gold film. TeO2 crystal shows tetragonal symmetry, and is highly anisotropic. The ripples for this (001) crystal cut are extremely complicated owing to the strong anisotropy and consequent phonon focusing. Unfortunately, tablecloths with this special blue pattern are not available! The animation on the right shows a three-dimensional view of part of the same region.
Three different types of acoustic waves are detected: surface acoustic waves, pseudosurface acoustic waves, and longitudinal bulk acoustic waves travelling parallel to the surface. (Pseudosurface waves are like surface waves, but are slightly lossy and are always faster than surface waves in any given direction.)
Most people don't realise that they are actually carrying rippling crystals in their pocket, inside their cellphone. Tiny chunks of crystal with surface acoustic waves travelling across them are used as filters to discriminate between the signals entering the telephone. Our technique could in the future be used to help design better filters by visualisation of the ripples on these devices.
To animate, click the middle image. (109 kb movie)
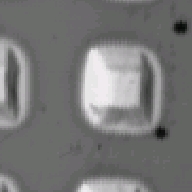
The animation (in the middle) shows a 90 micron × 90 micron region of a crown glass substrate coated with a 140 nanometre chromium film and minute gold pyramids 1 micron in height and 40 microns in width at the base (see diagram). The position of the gold pyramid can be seen from a standard optical image (on the right).
The refraction of the acoustic wave front as it passes through the gold pyramid (with lower sound velocity than the surrounding area) causes the curvature of the wave front to invert. See how the waves scatter on exiting the pyramid.
To animate, click the left image. (372 kb movie)
This animation shows what happens when two points are used to excite the ripples on a 90 micron × 90 micron region of a gold film on glass. The apparatus for excitation is also shown. The waves interfere with one another, producing a characteristic pattern. Ripples on water also produce the same sort of interference pattern.
We have also been able to model the ripples on glass and on crystals. The following figures show experiment and theory side by side. In these figures the white colour corresponds to motion in the direction out of the sample plane and the blue colour to motion into the sample.
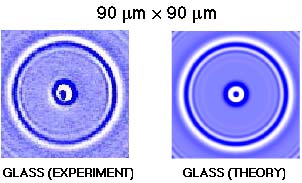
This shows a comparison for a crown glass sample. The theory includes the effect of the finite thickness of the 70 nanometre gold film .
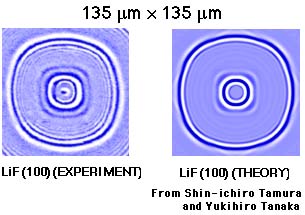
This shows a comparision for a lithium fluoride (100) sample. The theory does not include the effect of the 50 nanometre gold film.
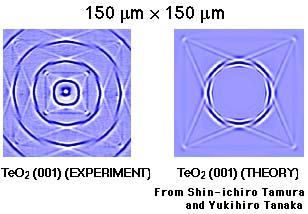
This shows a comparision for a tellurium oxide (001) sample. The theory does not include the effect of the 40 nanometre gold film. Only one theoretical wave front is shown.
To animate, click the image. (136 kb movie)
This last animation shows a 90 micron × 90 micron region of a tellurium oxide (TeO2) crystal of thickness 1 mm coated with a 60 nanometre gold film. For this (100) crystal cut the sound velocity is different in the horizontal and vertical directions, so we see elliptical wavefronts.
We have also modified our experimental technique for application to opaque substrates. See 'Scanning ultrafast Sagnac interferometry for imaging two-dimensional surface wave propagation', T. Tachizaki, T. Muroya, O. Matsuda, Y. Sugawara, D. H. Hurley, and O. B. Wright, Rev. Sci. Inst. 77, 043713-1-12 (2006). We are now doing a variety of studies in surface-phonon 'optics' involving the animation of sound ripples on phononic crystals (artificial periodic structures that coherently scatter sound), phonon waveguides and phonon resonators. Now that we can dynamically visualize sound on crystal surfaces, who knows what fun we can have controlling sound on surfaces in the way scientists are used to controlling light?
More details are given in the paper 'Watching ripples on crystals', Y. Sugawara, O. B. Wright, O. Matsuda, M. Takigahira, Y. Tanaka, S. Tamura and V. E. Gusev, Phys. Rev. Lett. 88, 185504 (2002) and in the List of publications.